Published :
Updated :
 For all latest news, follow The Financial Express Google News channel.
Whenever we go grocery shopping, prices, particularly food prices feel much more than the single-digit inflation figure suggests. Economic statistics can often obscure lived experience, and our daily reality often tells a different story, the one of steadily eroding purchasing power over years and decades.
This gap between official numbers and reality shows a problem in how we track inflation in Bangladesh. Policymakers usually focus on year-over-year rates, which are currently around 8-9 per cent. But we rarely look at how prices build up over many years. This long-run view matters for families, businesses, and policy decisions.
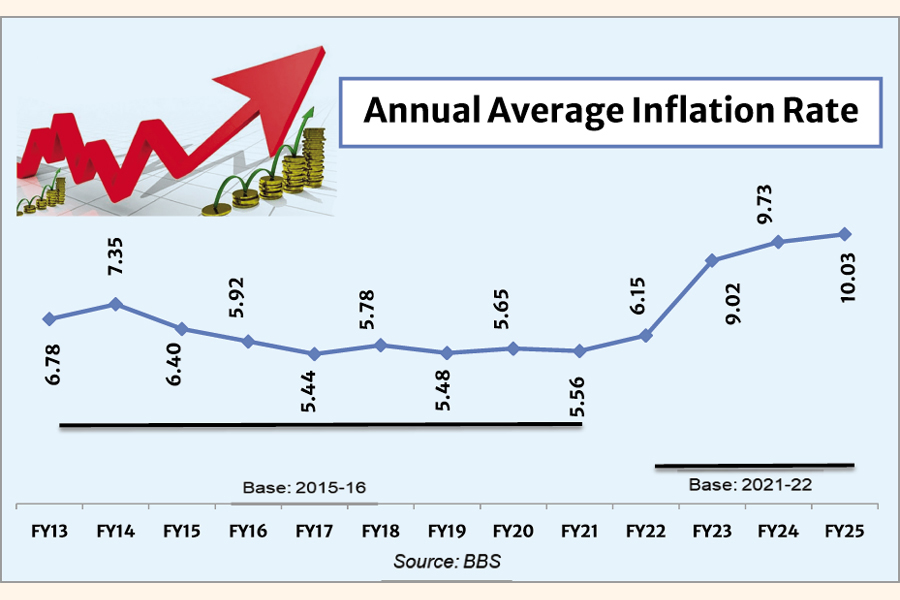
To trace back how price levels have changed over roughly the last two decades, we calculate cumulative inflation since 2000-01, giving us nearly a quarter-century of price data. During these 25 years, Bangladesh's statistical office changed the CPI base year three times, from 1995-96 to 2005-06, then to the current 2021-22 base.To make meaningful comparisons across this entire period, we converted all the data to a consistent baseline using the latest 2021-22 base year. This technical adjustment ensures that price changes from different periods can be compared accurately. It offers a complete long-term picture of how inflation has actually affected families over nearly a quarter-century.
The calculations show that overall prices (the general CPI) went up 353.0 per cent between 2000-01 and 2023-24. This means the general cost of living increased more than four-and-a-half times. What used to cost Tk 100 in 2000-01 now costs over Tk 453.Notice that the 353 per cent inflation means prices increased by Tk 353 on top of the original Tk 100, not to Tk 353 total. The formula used is: original price + (inflation rate × original price) = 100 + (3.53 × 100) = 100 + 353 = 453 taka.
Among the major categories, food prices increased the most at 401.5 per cent. This hits hardest because food takes up a big chunk of household budgets, especially for fixed-income and lower-income families. Rice, lentils, vegetables, and other basics that families could afford easily in 2000-01 now eat up much more of their income. This is why our family budgets feel stretched even after increases in income.
Non-food items covering clothing, housing, transportation, and other necessities, went up by 288.7 per cent. But within this category, some items increased much more sharply. Furniture and furnishing jumped 365.2 per cent meaning what families spent Tk 1,000 taka on in 2000-01 now costs over Tk 4,652. Transport and communication rose 396.1 per cent, while clothing and footwear increased by 325.1 per cent. Medical care and health went up by 234.8 per cent, and miscellaneous goods and services - covering everything from personal care to education - rose 369.1 per cent. Only recreation and education showed smaller increases at 170.3 per cent, though even this means costs nearly tripled.
Unlike annual inflation rates, which tell us what is happening now, cumulative inflation shows the long-term damage to purchasing power and living standards. It answers the question every family asks: "Why does everything cost so much more than before?" It also helps policymakers assess whether wages have kept pace with real cost increases.
A 25-year span might be hard to remember clearly, so let's examine cumulative inflation since 2010-11 or a 13-year period that shows medium-term trends. From 2010-11 to 2023-24, general prices increased by 138.2 per cent, while food prices rose even more sharply at 143.8 per cent. This means what cost Tk 100 in 2010-11 now costs 238 taka, and food items that cost 1,000 taka then now cost over Tk 2,400 after 13 years. Non-food items increased by 131.8 per cent, showing that price pressures have affected every aspect of household budgets over more than a decade.
Since 2020-21, when the COVID pandemic began, general prices have increased by 26 per cent in just three years-an annual average of nearly 9 per cent. Food prices jumped 26.7 per cent during this period, meaning that Tk 1,000 worth of food at the pandemic's start now costs Tk 1,267. Both the medium-term and pandemic-era data show that inflationary pressure has been relentless and sustained, not just a recent phenomenon.
There are good reasons why statistical agencies update base years. People buy different things now than before. Many goods that were once in our basket may not be there anymore - like cassette tapes, which most families in Bangladesh no longer buy. Meanwhile, new products appear such as internet services, smartphones, and ride-sharing apps that didn't exist in 2001-02. Besides, the quality of many goods and services improves over time. Think of how mobile phones evolved from basic calling devices to smartphones that can do everything. So to capture all these changes, statistical agencies need to update their base years after certain periods.
However, changing base years can hide the cumulative impact of inflation. When we reset the baseline to 100 during high-price periods, future increases look smaller. For example, a 7 per cent increase from the new base sounds modest, but it's on top of the 271 per cent increase since 2001-02. The intention here is not about pointing fingers or challenging statistical methods. It's about helping ensure economic information serves the public by giving complete information.
These numbers represent substantial changes in living standards. A middle-class household that earned Tk 50,000 monthly in 2000-01 would need about Tk 227,000 taka today to maintain the same standard of living. For policymakers, these figures raise critical questions about minimum wages, social programs, and poverty measurement. If wages haven't kept pace with 353 per cent general inflation, real incomes have declined significantly, affecting millions of families.
Official wage data show that while general prices rose 138.2 per cent between 2010-11 and 2023-24, wages rose only 111.7 per cent. In real terms, workers can buy less today despite higher nominal pay. This inflation-wage gap has persisted across all eight administrative divisions. Recent statistics from the Food and Agriculture Organization of the United Nations (FAO) indicate that the number of people facing acute food insecurity increased from 16.5 million to 23.6 million. With roughly 85 per cent of Bangladesh's workforce in the informal sector, most workers remain unprotected from this erosion of real income.
This persistent erosion of purchasing power has broader economic implications. Paradoxically, although rising prices can signal profit opportunities that attract investment and new businesses, Bangladesh's sustained high inflation has had the opposite effect. Uncertainty about future costs, declining real purchasing power that shrinks consumer demand, and rapidly rising input costs that squeeze margins all discourage productive investment. Instead of spurring growth, persistent inflation creates instability that deters the very business activity needed to expand supply and moderate prices.
In conclusion, the question is not about choosing between current inflation tracking and cumulative analysis, we need both. One practical way forward is to adopt chain-weighted CPI methods with regularly updated weights. This approach captures evolving spending patterns while preserving historical comparability, without obscuring the cumulative price buildup that households actually experience.
The author is an economist and independent researcher.
Email: syed.basher@gmail.com