Distress prediction in banking -- tools, issues, and some observations

Published :
Updated :
 For all latest news, follow The Financial Express Google News channel.
Compared to non-financial entities, a bank has to work with much greater degree of multiple risks since it deals in others’ money, and deal out that money to others. Risk management is, therefore, one of the basic functions of a banking organisation. Early detection of any risky trend leads to early remedial action. The central question is: how and what to detect? Every bank must make it an emergent duty to predict distress at reasonable intervals, and for this job at the individual bank level, a special department /cell /section may be set up with competent personnel, adequate materials, and necessary analytical devices.
A bank does not usually fall sick all on a sudden. On regular basis, checkup of bank’s health is essential. It is easy to watch and analyse the trends of some indicative relationships among relevant and important variables due to ever-flourishing information and communication technology. Thus, it is crucial to predict the probability of distress or failure by monitoring the trends of certain ratios and compliance of specific regulatory requirements. Here, a focus on tools, issues, and some historical data has been made in order to facilitate a user-friendly and simple prediction method from a practitioner’s viewpoint.
COMPLIANCE WITH CRR AND SLR: Maintenance of these ratios by banks is a regulatory requirement set by the central bank. Interbank clearing process has a direct relationship with CRR and SLR. The general liquidity position of a bank is reflected in CRR and SLR directly monitored by the central bank. For banks and other financial institutions, Bangladesh Bank has mandated cash reserve requirement (CRR) and statutory liquidity ratio (SLR), which are two vital instruments among indirect market-based influencers of reserve money. In Bangladesh , a traditional scheduled bank has to maintain CRR of 4 per cent on a biweekly basis ( but 3 per cent on a daily basis) and SLR of 13 per cent while CRR and SLR rates are respectively 4 per cent and 5.5 per cent for Islamic banking. SLR maintenance has been exempted for the specialised banks (except Basic Bank Ltd). Any shortfall in required reserve for CRR and SLR portends weakness in bank’s liquidity, and if predicte , earlier remedial action can be taken.
The issues of Bangladesh Bank Quarterly from April -June 2009 to January –March 2025 reported that almost all categories of scheduled banks had maintained required CRR and SLR except Private Commercial Banks (PCBs excluding Islamic Banks ) which showed shortfalls of required reserve for CRR at some points of time ( not during the whole year) in 2015, 2017 and 2019. However, some conflicting data are observed in a few issues of Financial Stability Assessment Report published by Bangladesh Bank. Concerned issues (April-June2023, July-September 2024 and January-March 2025) of Financial Stability Assessment Report revealed reserve shortfalls for CRR in case of Islamic Banks as a whole.
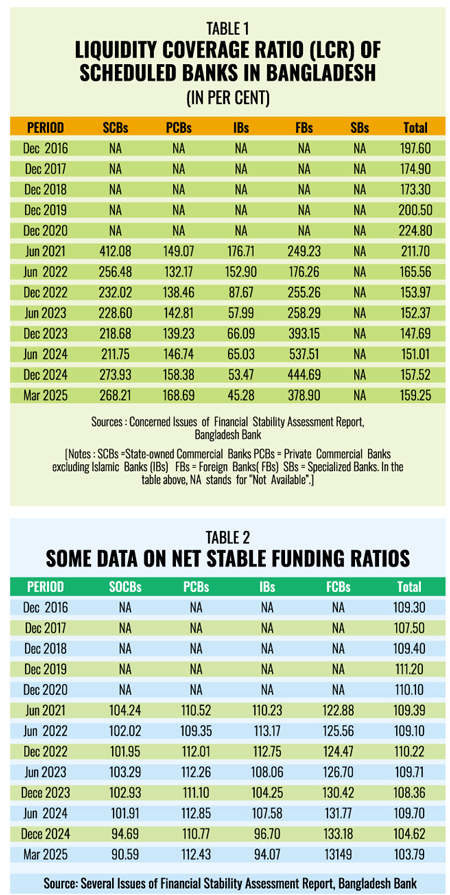 LIQUIDITY COVERAGE RATIO (LCR): Liquidity Coverage Ratio (LCR) is a measure of a bank’s capacity to meet its net cash outflows occurring over a 30-day stress period. Liquidity is generated from high-quality liquid assets (HQLA) held by a bank. In fact, LCR tests whether the bank can survive during a period of severe liquidity pressure; stability and people’s confidence in the banking ( or financial in broader term) system. Minimum standard for LCR is 100 per cent. LCR calculation involves many components such as HQLA, cash outflows and cash inflows each item of which has different run-off/dropdown/flow rates. Basel Committee on Banking Supervision (BCBS) and national regulator/supervisor determine these rates. But the individual bank has not been given any authority to set such rates of cash flows. This decision is beyond comprehension. Individual banks can set cash flow rates based on their real-life experience and then use them after getting approval from the national supervisor/regulator.
A significant observation from Table 1 is that LCR of Islamic banks (IBs) started falling even below the minimum standard of 100 per cent since December 2022. LCR appears to be an important predictor of distress as evidenced by the recent merger process of five distressed Islamic banks. Other bank clusters are still far above the LCR bottom line.
NET STABLE FUNDING RATIO (NSFR): NSFR is defined as the amount of available stable funding relative to the amount of required stable funding. This ratio should be equal to at least 100 per cent on an ongoing basis. “Available stable funding” is defined as the portion of capital and liabilities expected to be reliable over the time horizon considered by the NSFR, which extends to one year. The amount of such stable funding required (“Required stable funding”) of a specific institution is a function of the liquidity characteristics and residual maturities of the various assets held by that institution as well as those of its off-balance sheet (OBS) exposures. Stable and reliable funding sources are long-term, insured, and less flighty forms of money that stay with the bank for at least one year.
Available Stable funding sources include regulatory capital ( Tier 1 & 2), stable and less stable retail deposits, funding from non-financial corporates, sovereigns, public entities and multilateral development banks, and funding from financial institutions and corporates. Stable funding is required for meeting obligations relating to (i) lending (loans to customers), off-balance sheet commitments (undrawn credit line, guarantees and interbank exposures), and (ii) Investing in securities, equity, fixed assets, intangible assets, other assets (for example, deferred tax assets etc.. and derivatives).
 NSFR of Islamic banks (IBs) shows declining trends since December 2022, and tends to fall below 100 per cent since after June 2024. Although the banking industry’s NSFR meets the bottom line of 100 per cent, the ratios of several years from 2016 to March 2025 are not at the reasonably safe margin.
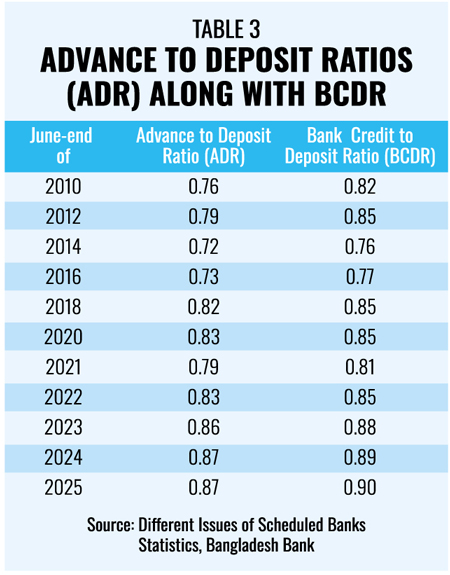
ADVANCE TO DEPOSIT RATIO (ADR): Advance to Deposit Ratio (ADR), also called Loan-to-Deposit Ratio (LDR), measures the proportion of a bank’s loans (advances) to its deposits. It is an indicator of liquidity management. Optimal range is typically 70–90 per cent, with 75–80 per cent often considered ideal in many emerging markets. Banks must balance between profitability and liquidity because Low ADR g Low risk, lower profit, while High ADR g High profit, higher liquidity risk.
It is seen from Table 3 that ADR and BCDR of the scheduled banks have remained within the optimal range during the 15-year period. Ideal range of 75-80 per cent and bank credit to deposit ratio (BCDR) seem to be preferable for better liquidity management.
CAPITAL ADEQUACY: Bank’s capital is considered to be a risk-absorber to some extent. Basel I (1988), Basel II (2004), and Basel III (2010) set standards for maintaining capital adequacy. It is measured by Capital to Risk (Weighted) Assets Ratio (CRAR), otherwise called Capital Adequacy Ratio (CAR). A portion of capital is kept to absorb a proportion of bad loans/NPL. Consequently , shareholders and employees get deprived of their due shares in the form of dividend and pay incentives.
It is observed from Table 4 that state owned banks (SOBs) failed to meet CAR standard over 15-year period and Specialized Banks ( SBs) have registered alarmingly high levels of capital shortfalls since 2010, and capital erosion still continues. Capital position of PCBs also suffers from shortfalls in many years with declining trends since 2024.The overall capital adequacy during the time span of 15 years is below the standard set by central bank and Basel Committee. After all, that we have poor equity base is clear. But the acceptability of CRAR as a good predictor of distress has not been tested. We should empirically investigate the impact of capital shortfalls as a contributor to distress.
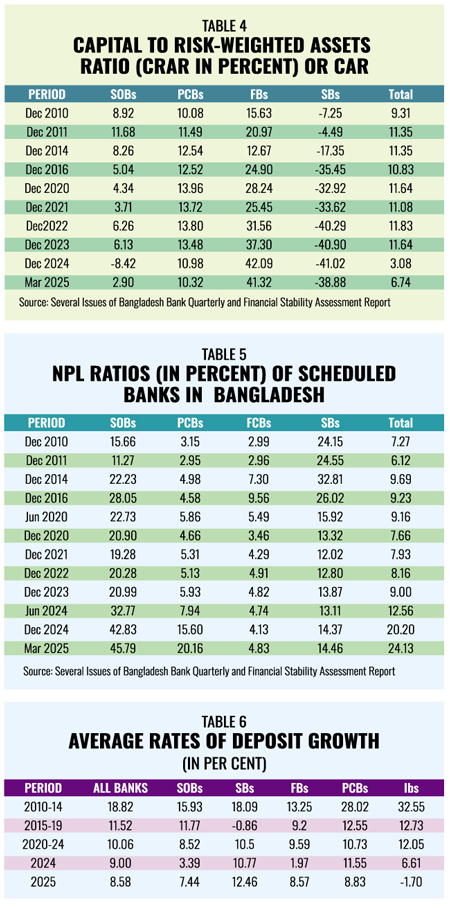 NON-PERFORMING LOAN (NPL ) RATIO: It is one of the most dominating variables that predict the probability of distress. But we have limitations regarding data sufficiency and reliability. Combined data on Islamic Banks’ NPL are not available separately in the central bank’s publications.
Table 5 shows that NPL has been surging rapidly in all categories of banks except specialised banks (SBs) where average trend shows a declining picture (perhaps due to two-thirds of their advances extended to agricultural sector which has a NPL ratio of 11 per cent). It is learnt from Financial Stability Report of 2024 that on sectoral analysis, industrial loans have the highest ratio of NPL i.e., more than 41 per cent.NPL ratio may be tolerated up to a maximum of 5 per cent but exceeding that limit signals movement towards distress; crossing 10 per cent limit means first entry into distress; and surpassing 20 per cent signifies acute distress. There is a need to test these hypotheses. The five Islamic banks currently undergoing a merger process absolutely proves the accuracy of abnormal ratio of NPL as a dominating predictor variable.
RECOVERY RATE:It is a strong indicator of success in bank’s lending activities, profitability, liquidity, and survival. Unfortunately, the central bank publishes no systematic data from which we can calculate recovery rate based on size, sector and category of borrowers. Recovery data on agricultural credit are available in greater details, but recovery status reported appears to be inconsistent and fuzzy. We know what proportion of total loans is bad or non-performing but what percentage of loan dues has been recovered is not obtained. Available recovery data on industrial and other loans cannot be used as a predictor at all. Well-designed recovery data base needs to be developed with top priority as recovery ratio may be a good predictor of trends in cash inflows.
RATIO OF REALISED PROFIT: Paper profit cannot increase cash inflows while interest credited to depositors’ money turns into cash outflows in many cases. This ratio is an important variable to predict trends of cash flows generated by realised segment of profit from interest income. If unrealised interest on unclassified loans soars up, depositors’ money may be exposed to be eaten up unnoticeably.
PROFITABILITY: Profit growth indicates operational efficiency. Return on asset (ROA) is a measure of profitability, and preferable to return on equity (ROE) since the former is based on total investment funded from both equity and debt sources. If ROA shows rising trend, bank’s strength of survival grows up. Long-term declining as well as negative ROA indicates that the bank is moving towards distress unless backed by the government. Profitability as a distress predictor is a variable for internal analysis by the banks.
DEPOSIT GROWTH: Deposit is the lifeblood of banking operations. Maximum cash inflows occur from deposit. Gradual rise in deposit level is essential and indicates public confidence upon the bank. Reverse scenario is caused by insignificant or negative growth in deposit. It is also an indicator of whether the bank moves towards distress or not.
It is observed from Table 6 that positive growth of deposit prevails in all banks except Islamic Banks (IBs).
The essence of present discussion is that early warning system for banking operations needs to be developed and applied on regular basis. Internationally, there are many prediction models for banking. Indigenisation of those models and related variables is required in view of the nature of practices and experiences of our banking. Our problems and their root causes differ from international ones in many respects. Hence, some common and relevant variables have been selected and described briefly as tools for prediction of distress or failure so that individual bank management can perceive them easily. Prediction is a must for early prescription.
Haradhan Sarker, PhD, is ex-Financial Analyst, Sonali Bank & retired Professor of Management. sarkerh1958@gmail.com